
Unlocking Commercial Capital for Renewables
Finance for renewable power generation is not scarce. The problem is that commercial capital is not reaching many of the countries that need it most. Our analysis of renewable energy finance flows across 23 economies* finds that the real gap is increasingly about unlocking private investment, not simply mobilising more public money.
The global picture frames the point. Clean energy investment is on track to reach about USD 2.2 trillion in 2026, nearly double what flows to fossil fuels. Yet emerging and developing economies (outside China) capture less than 30% of total energy investment, and just 20% of power sector investment, despite being home to two-thirds of the world’s population. The gap is widening: clean energy investment is rising about 7% a year in advanced economies and China, but only 4% across other emerging markets.
*ABOUT THE SAMPLE AND DATA: This analysis covers 23 economies across Africa, Latin America and Asia, spanning both mature renewable markets and frontier ones. That allows us to compare how different investment risk profiles affect a country’s ability to attract commercial renewable finance for power generation. All figures are cumulative commitments over 2017–2021. Data is drawn from IJGlobal and OECD sources, and the sample was selected to keep coverage as balanced as possible across income groups.
The money is flowing, but it is pooling
Across the 23 economies in our sample, renewable energy investment, covering new project investment as well as bond issuance, refinancing and asset acquisition, is flowing, but not in the same way everywhere. The data reveals a sharp divide in how projects are financed: 11 countries finance roughly three quarters or more of their renewable investment through commercial capital, with Japan and the Republic of Korea relying on it entirely; another 11 finance less than 20% commercially; and five, Bolivia, Botswana, Nicaragua, Niger and Sudan, attracted no commercial capital at all over the period; Kenya, at 36%, is the only country in between.
Renewable energy capital mix, cumulative (2017-2021)
This is not a smooth progression from mature markets to emerging ones. The sample splits into two distinct groups: countries that attract commercial finance at scale, and countries that still rely heavily on development finance, with very few in transition between the two.
The concentration is not only in how each country finances its own projects; it is in how little of the total is shared. 88% of all commercial capital in the 23 selected countries sampled went to just five markets: India, Chile, Japan, the Republic of Korea and Brazil, with the top three alone taking more than 60%.
Top 5 countries with the largest commercial capital share, cumulative (2017-2021),
across the 23 selected countries
Technology type follows a clear ranking. Wind draws the highest commercial share, followed by solar and then hydropower. However, high commercial shares do not mean broad participation. Across all three technologies, commercial investment still concentrates in the same few markets.
Capital mix of renewable energy commitments, by technology (2017-2021)
A low commercial share is not a failing grade. Our analysis shows that the countries at the bottom of the list finance their renewables almost entirely through development capital. The OECD notes that fragile and nascent markets often require high levels of concessionality before private capital can enter, and this is where development capital can provide more impetus. From our analysis, nascent markets are not those that are necessarily falling behind; they are markets where commercial capital has yet to scale alongside public finance. By the same OECD benchmark, progress would see commercial finance increase and reliance on concessional support decline over time. That is where the greatest opportunity for growth lies.
Commercial capital and market scale
The 23 countries span an enormous range: Botswana attracted USD 42 million in renewable energy investment over five years, while India attracted nearly USD 35 billion, a difference of more than 800-fold, and the more plausible reading is that commercial capital is what lets investment reach that scale.
The message from the graph is clear: within this sample, the scale of investment the energy transition requires has only been reached by markets with a substantial commercial share. No country has reached the top of the investment range while still relying mainly on development finance to get there.
Commercial Capital vs. Total Investments
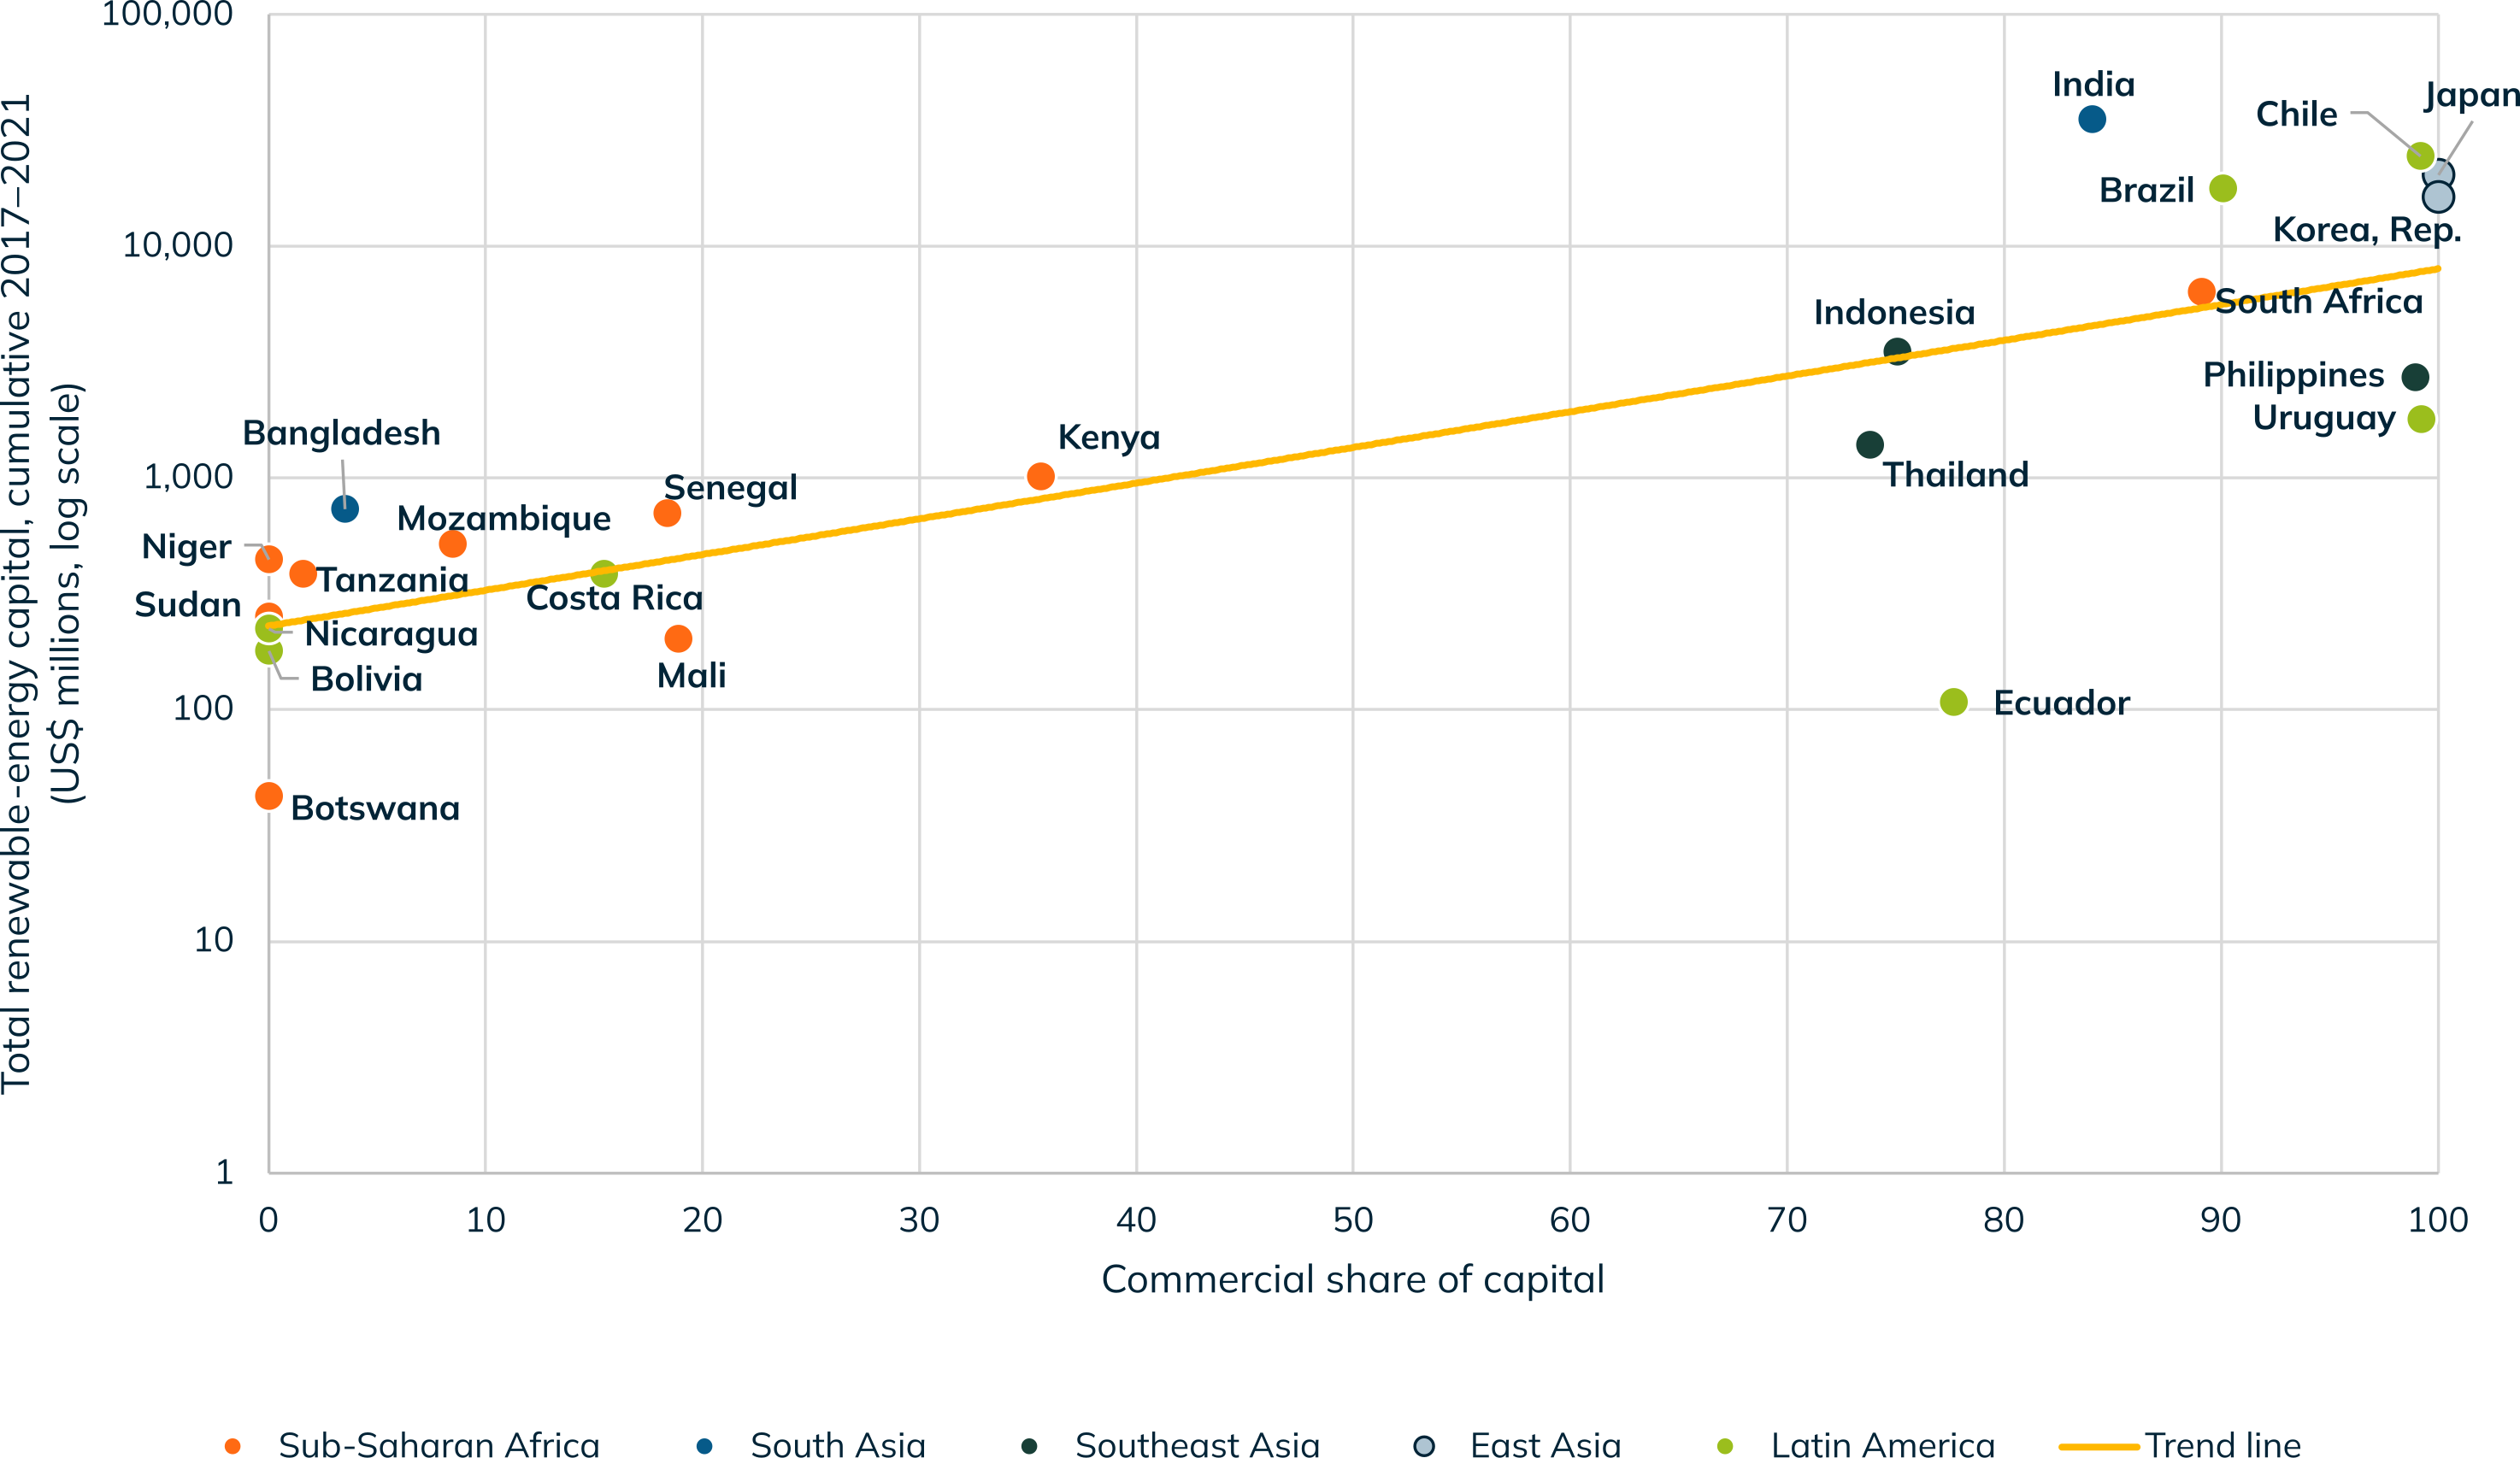
The implication is practical: building the conditions that let commercial capital in, market by market, is what will allow these markets to reach the scale the transition needs.
Where commercial capital remains limited, development finance carries much of the investment burden. For example, for every dollar of commercial capital committed, Sub-Saharan Africa drew around 59 cents of development finance over the period, Latin America just 6 cents, and East Asia none at all. In those markets, public money is not only filling a gap, it is helping build the conditions that private investment needs to follow.
Public money per commercial dollar in the 23 selected countries, by region, cumulative (2017-2021)
Making room for commercial capital
The task now is to crowd private investment into the markets commercial capital has so far skipped. The data shows where that counts most: the 11 countries financing less than a fifth of their renewables commercially, where public money is currently doing nearly all the work. For policymakers, that is where energy transition planning has most to gain. For development finance institutions and investors, there is an opportunity to deploy catalytic capital to unlock private money that would not otherwise flow.
Renewable commercial finance follows conditions that make revenue and returns predictable, so unlocking it means building those conditions where they are missing, not adding to where capital already gathers.
Understanding what draws commercial capital into a market is where this series goes next. This first piece maps where the money flows and how it relates to market scale. The posts that follow explore the factors that shape commercial investment decisions, including financial development, policy incentives, political commitment, regulatory frameworks, infrastructure and the broader business environment. Together, they help explain why private capital flows to some markets and not others, and what governments and partners can do to change that.
Follow the series as we build the full picture of how to unlock commercial capital for renewable energy.
Related content


