
Sub-national cooling risks

|
Sub-national, location-specific analysis can identify populations that face cooling access challenges due to local weather, socio-economic and infrastructure conditions that may not be apparent due to higher incomes and reliable electrification at the country level. Sub-national cooling risk assessments are important to identify and close cooling access gaps and ensure that no one is left behind. |
Chilling Prospects 2020 introduced a methodology to assess the global populations that are at risk due to lack of cooling access at sub-national level, recognizing that cooling risks vary within large countries due to differences in population, climate and socioeconomic conditions. Sub-national level data can help identify regions of a country that face greater risks than other regions.
The objective of identifying cooling risks at sub-national level is to inform and encourage policymakers to address access to cooling for populations at the highest risk. Undertaking such an exercise reduces the risk of overlooking factors that can be detrimental to people’s health, productivity and quality of life. By conducting a sub-national risk assessment due to lack of access to cooling, localized plans can be developed to improve access to cooling and limited local resources can be prioritized. Sub-national access to cooling issues identified can then be accounted for in national cooling plans, especially in countries that have large economic disparities or where sub-national governments enjoy greater implementation effectiveness.
The methodology introduced in Chilling Prospects 2020 formulated a case study for India and evaluated sub-national data for average maximum temperatures, cooling degree days (CDDs), income levels and cooling appliance ownership for determining risks [1] for populations living in different states. The India case study identified 14 states to be at high risk, nine states at medium risk and seven states at low risk. It showed that risk levels for a country with large geographical and socioeconomic diversity can be attributed to local conditions.
The India case study also found that certain indicators for assessing cooling risk may not accurately reflect the comparative risks between different geographic locations. For instance, CDDs alone may not be an effective indicator; Tamil Nadu had 3,045 CDDs making it on average hotter than Andhra Pradesh that had 1,527 CDDs, but as the latter reached higher peak temperatures of 45°C, its population living in higher temperatures without access to cooling is at higher risk.
Similarly, socioeconomic or other local conditions can also change the risk levels at the sub-national level for those without access to cooling.
Case studies
India: Examining populations with lack of access to cooling at district level in Indian states (PDF)
Mexico: Understanding the sub-national cooling risks of a non-high-impact country (PDF)
Pakistan: Assessing sub-national levels at risk due to lack of access to cooling (PDF)
Methodology to assess sub-national access to cooling risks
This report examines a more comprehensive methodology that evaluates key factors of the risks due to lack of access to cooling with the use of geo-spatial data and tools to more easily identify regions that experience persistent exposure to high temperatures. This level of information is helpful to identify specific pockets within sub-national regions, for example a town or district that are home to populations that could be at risk. Geographic information system (GIS) tools are proving to be efficient in identifying sub-national levels of access to cooling and provide an added advantage of rendering information, such as average temperature or average peak temperatures, [2] to visually identify zones that need additional attention or deeper analysis. GIS tools can also be used to portray economic and infrastructure-related data to better gauge the risks associated with cooling access gaps and opportunities to address them. However, the data for such analysis, particularly socioeconomic and infrastructure information, are very limited and typically not open source.
Chilling Prospects 2021 has put special emphasis on obtaining, utilizing, and analyzing open-source and internationally recognized data, so that the methodology can be easily replicated, including by countries and governments without access to extensive funding and/or expertise for the GIS tools. The resources used in these analyses are recognized globally as being derived from various projects funded by the UN, the World Bank and similar organizations. They include climate data, [3] population data and administrative boundaries [4]. Local data were used, where possible, to analyze the cooling access risks at sub-national level (Table 2.1).
Table 2.1: Indicators for assessing cooling risks at sub-national level
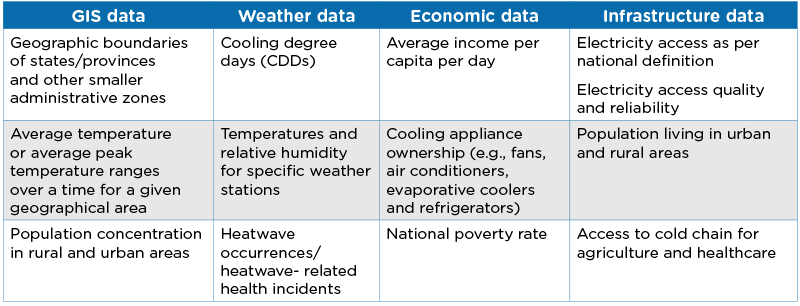
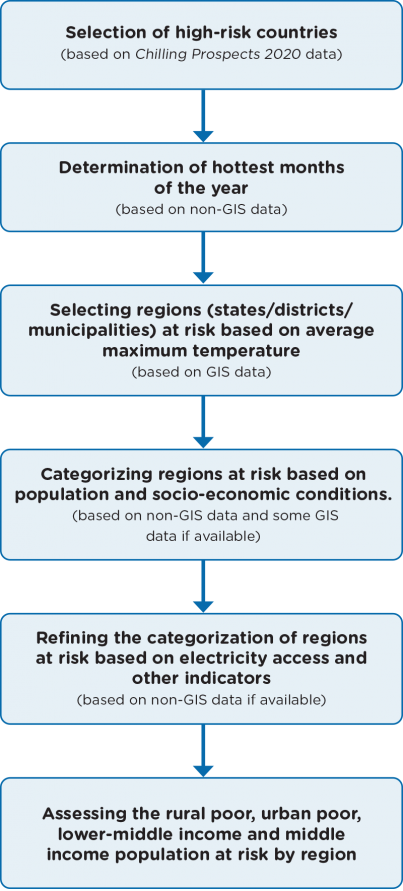
Accounting for the limited scope and time available for analysis of quantitative data across the different indicators, the methodology for Chilling Prospects 2021 uses GIS information specifically on temperature, visual rendering, and identification of administrative zones. Layering GIS data allows analysts to visually identify the locations that are exposed to high temperatures (above 35°C). If data are available then additional information, such as population, incomes, electricity access and electricity grid connections, can be layered on other GIS data to assess the risks associated with lack of cooling. Furthermore, information on passive cooling solutions that are relevant to local contexts such as building designs and nature-based solutions can be helpful for deeper evaluations for cooling access gaps. The 2021 sub-national cooling risk analysis uses a hybrid method, where the initial risk screening was carried out through a GIS tool [5] and subsequent risk assessment and regional cooling access disparities were analyzed with quantitative data (Figure 2.1). [6]
The key elements used in these analyses include temperature, GIS data, population density data, population data (quantitative national statistics), poverty data (quantitative national statistics or data adjusted to World Bank definitions), and tertiary data including for electricity access and appliance ownership where available. This model investigates cooling access gaps at sub-national levels mostly from a thermal comfort perspective with a limited assessment of food and nutrition security and healthcare and medical services. Further collection of cooling needs and sector-specific data, as identified in SEforALL's Cooling for All Needs Assessment, is needed for sub-national and national cooling assessments.
Figure 2.1: Methodology to assess sub-national access to cooling risks
Notes and references
1 High Risk: Per state capita Income less than USD 1.9/day, average maximum temperature above 35°C and CDDs above 1,900; Medium Risk: per state capita income between USD 1.9 and USD 5.5/day, average maximum temperature between 25 and 35°C; and CDDs between 1,000 and 1,900; Low Risk: per state capita income above USD 5.5/day, average maximum temperature below 25°C and CDDs below 1,000.
2 The temperature data range from January 2014 to December 2018.
3 WorldClim - WorldPop. An innovation of World Bank Group. Link
4 The Humanitarian Data Exchange. UN-OCHA. Link
5 Q-GIS software was used, which is a free and open-source cross-platform GIS software application that supports viewing, editing, and analysis of geospatial data.
6 GIS data refer to geo-spatial data that could be used with a GIS tool. Non-GIS data refer to quantitative and statistical data.


