Energy Efficiency


SEE THE NUMBERS
Quick facts
Context
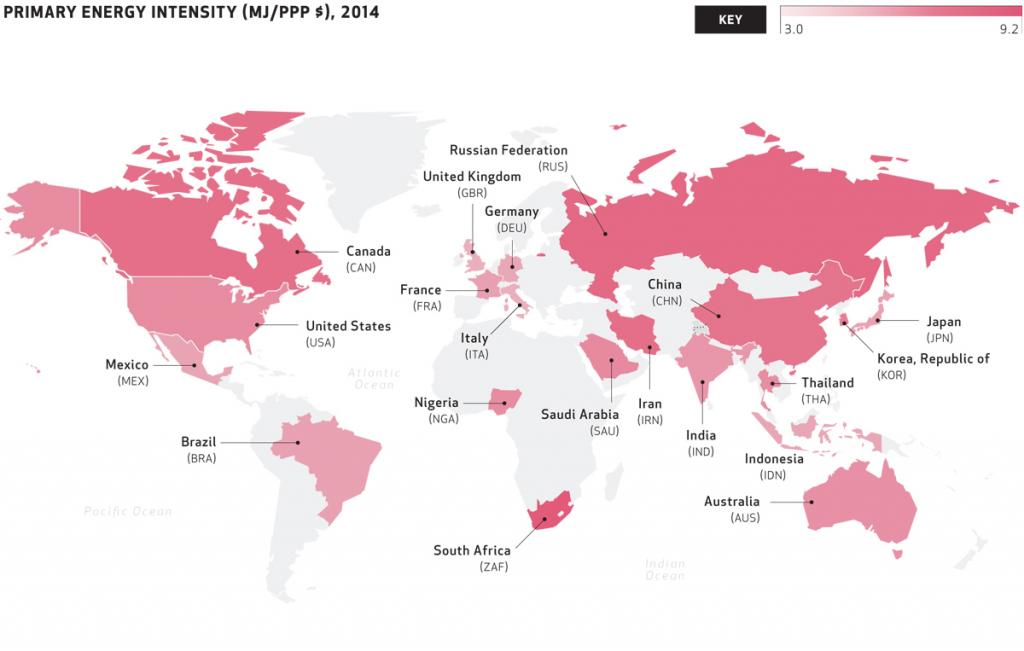
- Energy efficiency offers a huge and growing opportunity for the world to reduce emissions of greenhouse gases. The International Energy Agency estimates that global investment in energy efficiency was $221 billion in 2015, an increase of 6 percent from 2014 and 60 percent greater than investment in conventional power generation.
- Investing in energy conservation measures has the potential to cut fuel import bills, boost the economy and create numerous jobs, and is also essential to address climate change. Energy efficiency measures in International Energy Agency member countries generated energy savings of 450 million tonnes of oil equivalent in 2015 and reduced total energy expenditure by $540 billion. Even for the least developed countries increasing energy productivity now is a smart concept, as emphasized by multiple Nationally Determined Contributions including Bangladesh, Burkina Faso or Uganda.
- There has been some decoupling of growth and energy demand over 2012-14. In North America, GDP continued to grow while energy demand was falling, notably because of fuel switching from coal to more efficient natural gas in the US power sector. This decoupling effect was evident in the European Union as well as much of the developing world, except for Latin American and the Arab region.
- The intensity of final energy consumption in industry, agriculture, services, and transport are on a long-term downward trend with energy savings seen across the board. The residential sector on the other hand is a large and fast growing segment of energy consumption and is becoming more energy intensive. Improvements in the efficiency of thermal power generation and power networks have been relatively slow.
NOTES: 1. The dotted line represents approximately the Line of Control in Jammu and Kashmir by India and Pakistan. The final status of Jammu and Kashmir has not yet been agreed upon by the parties.
2. This map was produced by SEforALL. It is based on the UN Map of the World, which can be found here: http://www.un.org/Depts/Cartographic/map/profile/world.pdf. The boundaries, colors, denominations and any other information shown on this map do not imply, on the part of SEforALL, any judgment on the legal status of any territory or any endorsement or acceptance of such boundaries.
SOURCES: International Energy Agency (IEA) and the World Bank. 2017. “Progress Towards Sustainable Energy: Global Tracking Framework 2017” (April), World Bank, Washington, DC. Data extracted from http://gtf.esmap.org/ on 06/20/2017.DC.
Related Heatmaps

Data analysis
24 Jul 2025

Data analysis
16 Oct 2024

Data analysis
18 Jul 2023

Data analysis
18 Jul 2023
