
Sustainable cooling for cities
Due to various factors, cities all over the world have high temperatures that reduce the quality of life for the residents who call the cities home and the workers who spend the day in them. Understanding access to sustainable cooling gaps and urban heat exposure through better data and analysis can support improved policymaking and investment decision-making that mitigates high temperatures and improves access to sustainable cooling.
Urban heat exposure and urbanization
Urban heat is driven by climate conditions, the topography of the land, the urban built environment, and waste heat, among other factors. The features of the urban environment are known to cause a higher temperature than their rural, or less developed, surroundings, typically referred to as the urban heat island. [1] The urban heat island effect (UHIE) can cause city temperatures to be 1°C to 4°C higher on average — often most pronounced overnight — with maximum temperature differentials of up to 10°C being observed. Exposure to extreme heat in urban settings has increased by almost 200 percent since the mid-1980s and is estimated to affect 1.7 billion people. [2] UHIEs have proven to increase energy use, greenhouse gas (GHG) emissions, and waste heat from mechanical cooling, which in turn both creates and exacerbates urban heat, smog and air pollution. [3]
These urban heat conditions mean that urban populations are at higher risk of heat exposure than rural populations, with the poor and elderly being disproportionately affected. [4] Those who work outdoors, such as in marketplaces, in construction, or in under-ventilated spaces are also at risk from urban heat exposure. [5]
The challenge for many cities globally is that urban populations are growing rapidly. It is expected that 90 percent of urbanization in the next four decades will occur in Asia and Africa, [6] which currently face both extreme heat and limited access to sustainable cooling. [7] Even without the expected urbanization, cities already account for over 75 percent of global emissions on just 1 percent of the earth’s ice-free land surface [8] and replicating business-as-usual urbanization threatens the long-term sustainability of energy systems, the climate and human lives.
The Intergovernmental Panel on Climate Change (IPCC) has highlighted the risks posed to cities from increasing temperatures without adaptation to climate change. [9] By 2080, in South and Southeast Asia alone, between 940 million and 1.1 billion urban dwellers could experience extreme heat that lasts more than 30 days a year.
Factors for urban heat exposure or effect
The relationships between people, place and environment provide a way of understanding which features are important to include when measuring and assessing heat exposure conditions. The impact of heat exposure for individuals depends on factors such as the nature and duration of heat exposure, their underlying health conditions, and their ability to adapt their conditions to mitigate or minimize exposure (e.g., reducing direct exposure to outdoor work, or affording and using air-conditioning).
Heat exposure itself depends on conditions in urban areas of:
- location characteristics, such as climate, weather conditions (including temperature, humidity and wind speed), topography, movement of air, and the amount and type of natural surroundings of the city;
- physical infrastructure, such as building and material choices for city design, access to electricity, availability of water- and nature-based infrastructure such as street tree canopies and vegetated/forested areas; and
- social infrastructure, such as health services and cooling alert systems.
Elevated ambient heat conditions are the product of changes in the urban and surrounding landscape that affect local climate conditions when compared to historic trends. Climate change is also a key driver of changes in ambient heat conditions and plays a major role in increasing urban heat conditions quickly compared to urban population growth. When investigating changes in ambient heat conditions, longitudinal data and long-term changes in land use, infrastructure and demographics are very important to understanding heat risks.
Measuring urban heat
Common measurements of heat exposure focus on two types of conditions, chronic ambient conditions (i.e., climate) and acute or extreme conditions (i.e., heat waves).
There is a range of commonly used temperature and environmental indicators to measure urban heat conditions, each of which describes different aspects of heat conditions experienced (see Box 1). When evaluating urban-heat conditions, these temperature-related measurements are used alongside other urban-feature indicators that are linked to heightened heat exposure risk, such as land-use change, population growth and structure, energy access and affordability, and socioeconomic data.
Box 1: Urban heat measurement indicators
|
Land surface temperature (LST): The measure of how warm or cold the earth surface is to touch in any given location. Typically measured through satellite, the LST correlates to air temperature. Daily mean temperature (DMT): The mean of the temperatures observed over a continuous 24-hour period. Days with Tmax >XºC: The number of days with a maximum temperature (Tmax) above threshold temperatures (e.g., 25°C or 30°C). Heat wave: [10] When the three-day-average DMT compared to the annual temperature threshold at a particular location is higher than the 95th percentile of DMT for a three-day-period, it is defined as a heat wave. The three-day period is then compared to the past 30 days to determine intensity. Monthly maximum value of daily maximum temperature (TX): The daily maximum temperatures in a given month for a given period. Daily temperature range (DTR): The monthly mean difference between the monthly maximum value of daily maximum temperature (TX) and the monthly maximum value of daily minimum temperature. Wet bulb globe temperature (WBGT): A measure of the heat stress in direct sunlight that takes into account temperature, humidity, wind speed, sun angle and cloud cover. The WBGT provides a measure for assessing the risk of heat conditions and outdoor activities (work or exercise). Heat index / apparent temperature: [11] The temperature as it feels to the human body when relative humidity and air temperatures are combined. The measure provides a way of accounting for how air conditions remove sweat from the human body through evaporation. An air temperature of 30°C and relative humidity of 60 percent will have a feels like temperature of 33°C and indicates an extreme caution heat index. |
In addition to heat measurements, there are numerous drivers and factors that affect an individual’s or a population’s exposure to heat. A useful framework for understanding the impacts of urban heat exposure is through risk assessment, which defines hazards, vulnerabilities and exposures, and can be applied to urban geographies to evaluate heat risk. [12]
Together, these non-exhaustive parameters define the incremental heat exposure for a given place and contribute to the risk of being exposed to excessive heat levels that place a burden on people, government and businesses.
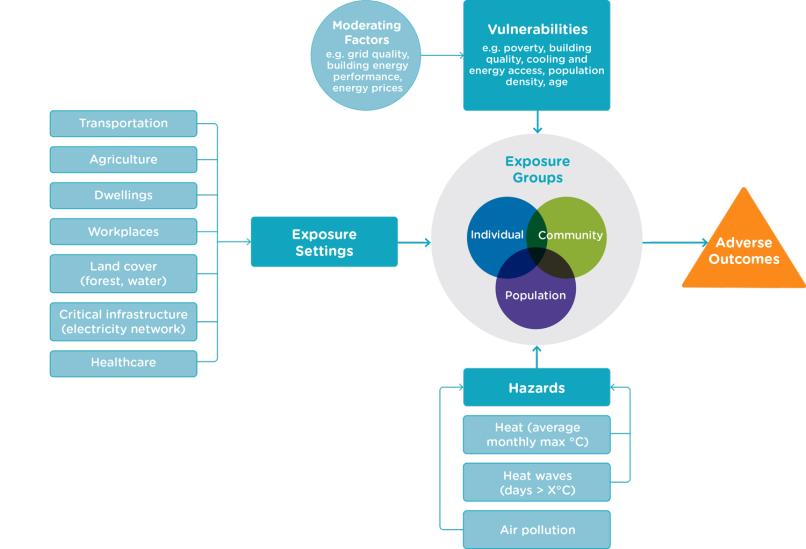
A risk assessment framework applied to urban heat exposure works to identify the set of factors that act to influence the risk for people, place and environment to being exposed to heat that would be considered excess or potentially unsafe (see Figure 2.24). It uses hazard features, such as the level and frequency of heat experienced, and modifiers, such as air pollution. It accounts for the point of exposure, i.e., workplaces, housing and public spaces, and features of vulnerability, such as population density, poverty levels and access to electricity or cooling. It also considers the climate and topographic features that further act to modify heat exposure, such as green space or mountain features.
Figure 2.24 – Urban heat exposure risk assessment framework, SEforALL
A heat exposure toolkit for cities
As cities focus on addressing the implications of a changing climate and future population growth and the associated infrastructure and social services, alongside the form and function of the city, there is a need for toolkit approaches that provide an understanding of the risks being faced and their drivers, as well as strategies that aim to both mitigate and adapt to heat.
The This is Cool Solutions Assessment Toolkit provides guidance for city policymakers interested in knowing what policies are available to mitigate and address heat and lack of cooling services within their cities. Additional resources include the Cool Coalition’s Beating the Heat: A Sustainable Cooling Handbook for Cities, as well as primers from the World Bank Energy Sector Management Assistance Program (ESMAP) unit on Reducing Excessive Urban Heat.
In focusing on where to apply policies that act to reduce heat exposure and vulnerabilities, city officials can put in place strategies that both reduce urban heat conditions and invest in measures that help cities to adapt to increasing heat conditions. City officials can also look to increasing resilience and reducing vulnerabilities for people through social services, such as cooling centres, heat wave warning systems, and supporting people during heat waves.
Policymakers in cities face considerable challenges in how to manage drivers affecting current and future heat conditions but can use an integrated urban heat exposure risk assessment tool to evaluate risks and identify measures that can move cities towards safe heat conditions and sustainable cooling solutions.
Analysis of urban heat implications from land-use change
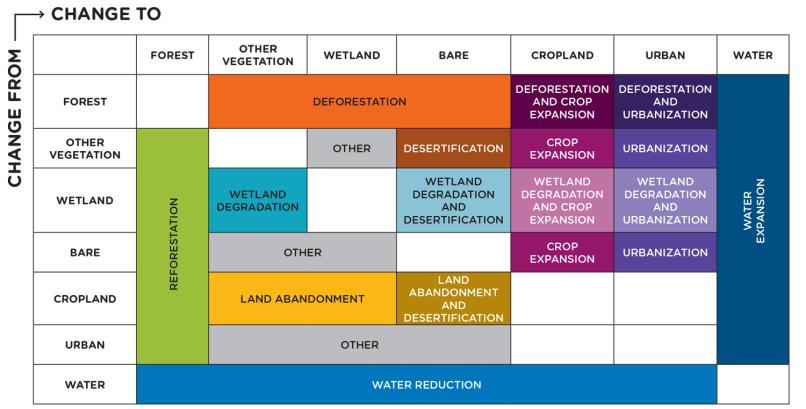
The following analysis examines the impact of land-use change since 2015 in major cities in each of the Critical 9 countries and examines the implications of urbanization for urban heat. The annual global land-cover change maps [13] from the Copernicus Land Monitoring Service [14] form the basis of this analysis and the year-over-year land-use change was measured using QGIS [15] and Rstudio. [16]
The analysis uses mean projections for each city using IPCC’s most optimistic emissions scenario – [17] the Shared Socioeconomic Pathway (SSP1-1.9 scenario) from the Climate Change Knowledge Portal, [18] where the global CO2 emissions are cut to net zero around 2050. This is the only scenario that meets the Paris Agreement’s goal of keeping global warming to 1.5°C above preindustrial temperatures.
Figure 2.25: Annual change occurrence and change processes
Urban land-use and heat analysis in major cities of the Critical 9 countries
Data analysisNotes and references
[1] Oke, T. R. (1973). City size and the urban heat island. Atmospheric Environment, 7(8), 769–779. https://doi.org/10.1016/0004-6981(73)90140-6
[2] Cascade, T., Kelly, C., Chris, F., Andrew, V., Stuart, S., Kathryn, G., Pete, P., & Tom, E. (2021). Global urban population exposure to extreme heat. Proceedings of the National Academy of Sciences, 118(41), e2024792118. https://doi.org/10.1073/pnas.2024792118
[3] Mi Aye Su, Jack Ngarambe, Mat Santamouris, Geun Young Yun, Empirical evidence on the impact of urban overheating on building cooling and heating energy consumption, iScience, Volume 24, Issue 5, 2021,
[4] Heaviside, C., Macintyre, H., & Vardoulakis, S. (2017). The Urban Heat Island: Implications for Health in a Changing Environment. Current Environmental Health Reports, 4(3), 296–305. https://doi.org/10.1007/s40572-017-0150-3
[5] Ebi, K. L., Capon, A., Berry, P., Broderick, C., de Dear, R., Havenith, G., Honda, Y., Kovats, R. S., Ma, W., Malik, A., Morris, N. B., Nybo, L., Seneviratne, S. I., Vanos, J., & Jay, O. (2021). Hot weather and heat extremes: health risks. The Lancet, 398(10301), 698–708. https://doi.org/10.1016/S0140-6736(21)01208-3
[6] Cascade, T., Kelly, C., Chris, F., Andrew, V., Stuart, S., Kathryn, G., Pete, P., & Tom, E. (2021). Global urban population exposure to extreme heat. Proceedings of the National Academy of Sciences, 118(41), e2024792118. https://doi.org/10.1073/pnas.2024792118
[7] SEforALL. (2020) Chilling Prospects: Tracking Sustainable Cooling 2020. Link.
[8] BiodiverCities by 2030: Transforming Cities’ Relationship with Nature, World Economic Forum, January 2022. Link.
[9] Intergovernmental Panel on Climate Change, Sixth Assessment Report: Impacts, Adaptation and Vulnerability. February 28, 2022. Link.
[10] Nairn, J., & Fawcett, R. (2014). The Excess Heat Factor: A Metric for Heatwave Intensity and Its Use in Classifying Heatwave Severity. International Journal of Environmental Research and Public Health, 12(1), 227–253. MDPI AG. Retrieved from http://dx.doi.org/10.3390/ijerph120100227
[11] NOAA. (2022). What is the heat index? National Oceanic and Atmospheric Administration. https://www.weather.gov/ama/heatindex
[12] Tomlinson, C.J., Chapman, L., Thornes, J.E. et al. Including the urban heat island in spatial heat health risk assessment strategies: a case study for Birmingham, UK. Int J Health Geogr 10, 42 (2011). https://doi.org/10.1186/1476-072X-10-42
[13] Global Land Cover, Copernicus. Land Cover Viewer (vito.be)
[14] Buchhorn, M. ; Lesiv, M. ; Tsendbazar, N. - E. ; Herold, M. ; Bertels, L. ; Smets, B. Copernicus Global Land Cover Layers — Collection 2. Remote Sensing 2020, 12, Volume 108, 1044. DOI 10.3390/rs12061044
[15] Q-GIS software was used, which is a free and open-source cross-platform GIS software application that supports viewing, editing, and analysis of geospatial data. Discover QGIS
[16] RStudio is an Integrated Development Environment (IDE) for R, a programming language for statistical computing and graphics. About RStudio - RStudio
[17] The U.N. Climate report’s five futures – decoded. Explainer: The U.N. climate report's five futures - decoded | Reuters
[18] Climate Change Knowledge Portal (CCKP). About us | Climate Change Knowledge Portal (worldbank.org)