
Chilling Prospects 2022: Urban land-use and heat analysis in major cities of the Critical 9 countries
|
|
Chapter 2.4 Chapter 2 overview |
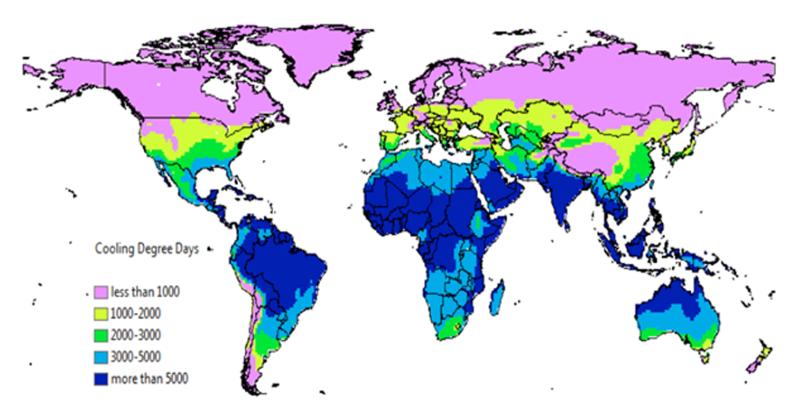
This analysis covers the most populous cities in each of the Critical 9 countries for access to cooling. As urbanization grows, areas of these cities with vegetation and green spaces are seeing increased buildup that has compounding effects. Adding density implies an increase in the Urban Heat Island Effect (UHIE) through the use of active cooling equipment. When buildup comes at the expense of natural heat sinks such as green space and water, the effect is multiplied, creating additional risk for the most vulnerable populations.
The following analysis examines the impact of land-use change since 2015 in major cities in each of the Critical 9 countries and the implications of urbanization for urban heat. The annual global land-cover change maps [1] from the Copernicus Land Monitoring Service [2] form the basis of this analysis and the year-over-year land-use change was measured using QGIS [3] and Rstudio. [4] It uses mean projections for each city using IPCC’s most optimistic emissions scenario – [5] the Shared Socioeconomic Pathway (SSP1-1.9 scenario) from the Climate Change Knowledge Portal, [6] where the global CO2 emissions are cut to net zero around 2050. This is the only scenario that meets the Paris Agreement’s goal of keeping global warming to 1.5°C above preindustrial temperatures.
Dhaka, Bangladesh
2015: 17,597,000
2019: 20,284,000
Present: 22,265,410
How to use the interactive map
|
|
|
Source: Climate Change Knowledge Portal, The World Bank Group, 2022 |
|
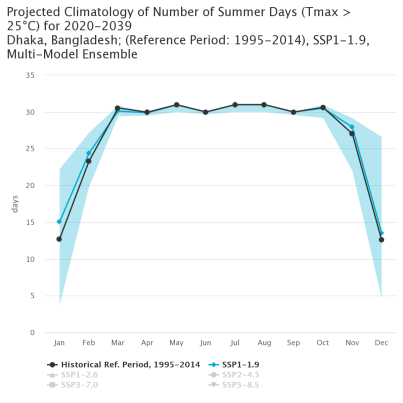
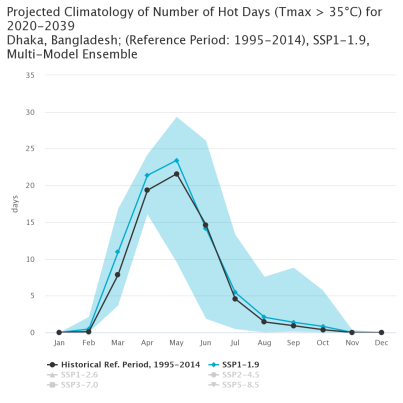
Between 2015 and 2019, Dhaka added 0.93 square kilometers of built-up area for domestic and commercial use. This buildup came at the expense of 0.27 square kilometers of herbaceous vegetation, 0.44 square kilometers of cultivated and managed vegetation, and 0.1 square kilometers of herbaceous wetland.
Dhaka is expected to experience sustained high temperatures above 25°C in the most optimistic scenario, and a significant number of dangerous heat days over 35°C between March and June annually. The loss of cultivated land for fruits and vegetables not only implies a reduced ability to grow crops locally, but also diminishes the resilience of a growing urban population to the dangers of extreme heat. Understanding this impact and placing emphasis on urban greening and land to cultivate produce is likely to benefit both the UHIE in the city as well as food security.
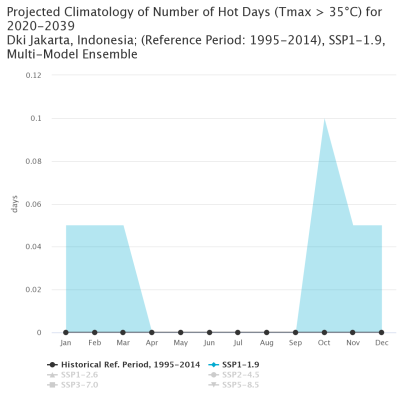
Jakarta, Indonesia
2015: 10,173,000
2019: 10,639,000
Present: 11,028,848
How to use the interactive map
|
|
|
Source: Climate Change Knowledge Portal, The World Bank Group, 2022 |
|
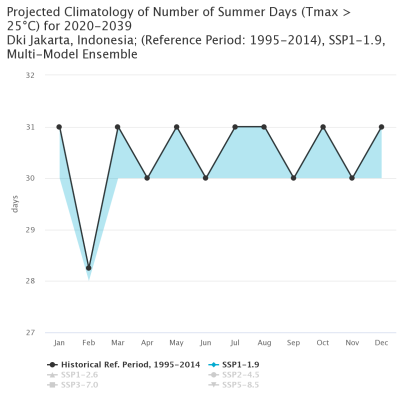
Between 2015 and 2019, Jakarta increased its built-up area by 0.87 square kilometers at the expense of 0.25 square kilometers of herbaceous vegetation, 0.19 square kilometers of cultivated and managed vegetation, and 0.1 square kilometers each of bare/sparse vegetation and water bodies. This process also included the removal of 0.14 square kilometers of open forest that would have had a passive cooling effect on urban areas.
These changes were driven by increasing urbanization, but in combination with a growing number of days above 25°C annually, are likely to exacerbate the UHIE in the city. Even though Jakarta is not projected to have many days with dangerous heat (above 35°C), this trend will lead to increased cooling needs that could dramatically increase energy demand if met with inefficient, active cooling technologies. An expansion of green urban areas through land-use planning would help reverse these losses and reduce heat stress felt by residents on high-temperature days.
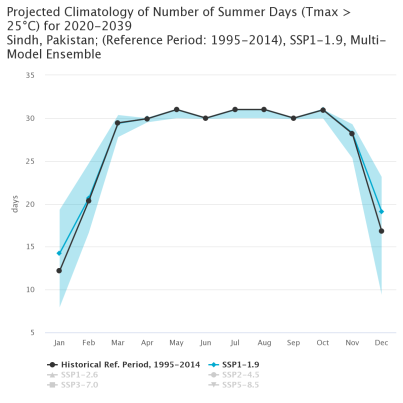
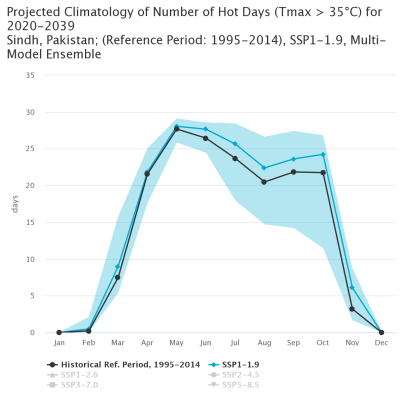
Karachi, Pakistan
2015: 14,289,000
2019: 15,741,000
Present: 16,730,070
How to use the interactive map
|
|
|
Source: Climate Change Knowledge Portal, The World Bank Group, 2022 |
|
Between 2015 and 2019, Karachi gained 6.63 square kilometers of built-up area at the expense of 1.82 square kilometers of shrubs, 0.18 square kilometers of herbaceous vegetation, 0.31 square kilometers of cultivated and managed vegetation, 3.6 square kilometers of bare or sparse vegetation, and 0.74 square kilometers of open forest.
Karachi made significant changes to its land-use patterns between 2015 and 2019, which has implications for food safety, agricultural production and thermal comfort. While the built-up area increased by 6.63 square kilometers, land used for cultivating produce grew by a significantly larger amount, 213 square kilometers. This provides the city with resources to grow local produce, benefitting residents and farmers through better food security and enhanced agricultural incomes, though there is a need for an expansion of the local cold chain to reduce potential post-harvest losses.
With Karachi set to experience a high number of days with dangerous heat between April and October every year, further urban planning efforts to reduce the UHIE and reliance on inefficient, mechanical cooling would especially benefit the most vulnerable urban dwellers.
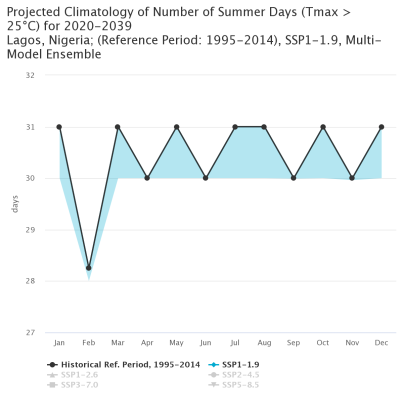
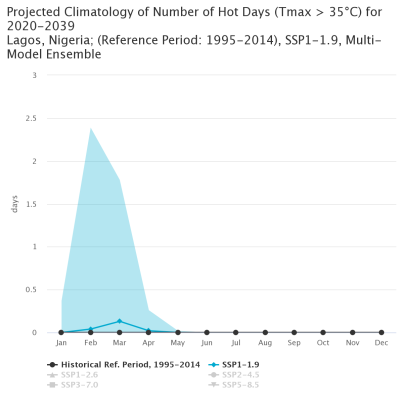
Lagos, Nigeria
2015: 12,239,000
2019: 13,904,000
Present: 15,236,259
How to use the interactive map
|
|
|
Source: Climate Change Knowledge Portal, The World Bank Group, 2022 |
|
Between 2015 and 2019, Lagos saw an increase of 0.43 square kilometers of built-up area. This came at the expense of 0.37 square kilometers of herbaceous vegetation, and marginal reductions in cultivated and managed vegetation, bare or sparse vegetation, water bodies and open forest.
Even in the most optimistic scenario, it is likely that there will be an increase in the number of days with dangerous heat (more than 35°C) per year for Lagos. Coupling this with rising sea levels, urbanization processes need to not only factor in human comfort and safety but also increased urban resilience.
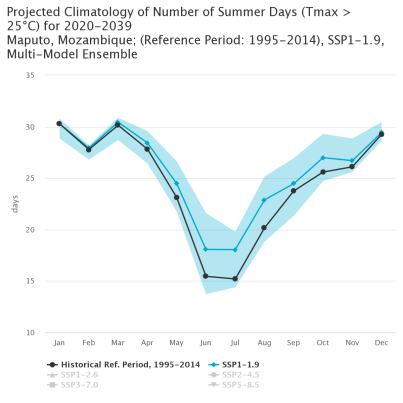
Maputo, Mozambique
2015: 1,100,000
2019: 1,104,000
Present: 1,134,096
How to use the interactive map
|

|
|
Source: Climate Change Knowledge Portal, The World Bank Group, 2022 |
|
Between 2015 and 2019, Maputo increased its built-up area by 0.3 square kilometers and lost 0.12 square kilometers of herbaceous vegetation, as well as marginal amounts of shrubs, cultivated and managed vegetation, water bodies and open forest.
Mozambique does not have a large urban population — 63 percent of its people still live in rural areas — [8] and this is reflected in the observed land-use changes. But the city is planning for expansion, including through the Maputo Urban Transformation Project. [9]
It is expected to see over four days of dangerous heat (+35°C) annually between September and February, presenting urban planners in Maputo with a unique opportunity to plan early for the increasing effects of heat, for example through natural heat sinks, increased green spaces and improved passive cooling measures.
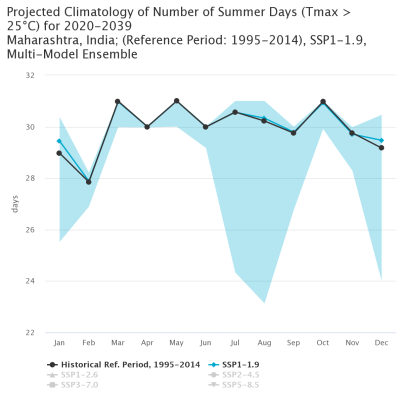
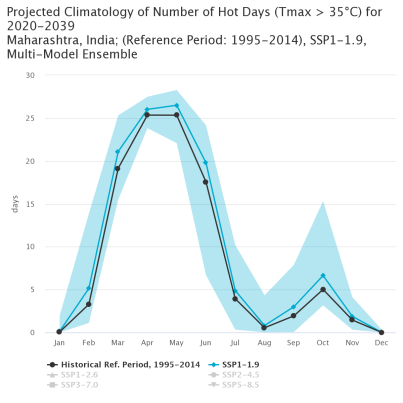
Mumbai, India
Population
2015: 19,316,000
2019: 20,185,000
Present: 20,876,486
How to use the interactive map
|
|
|
Source: Climate Change Knowledge Portal, The World Bank Group, 2022 |
|
Between 2015 and 2019, Mumbai gained 0.9 square kilometers of built-up area at the expense of 0.14 square kilometers of herbaceous vegetation, 0.14 square kilometers of cultivated and managed vegetation, 0.28 square kilometers of closed forest, 0.16 square kilometers of open forest, and lesser amounts from shrubs, bare/sparse vegetation and water bodies.
Each year large segments of India’s population move to Mumbai from rural areas for social, economic and environmental opportunities. This migration has contributed to the expansion of informal settlements, including the Dharavi slum that is now home to more than 1 million people. [10] With projections for at least 15 days per month of dangerous heat between March and June each year, these people will be increasingly vulnerable to a lack of access to cooling.
Heat-action planning, and public cooling centres are among the types of low-cost solutions that can help meet their cooling needs. So too is urban greening, which was prioritized by the Government of Maharashtra in its recent climate change action plan. [11]
Omdurman, Sudan
2015: (Reliable data not available)
2019: (Reliable data not available)
Present: (Reliable data not available)
How to use the interactive map
|
|
|
Source: Climate Change Knowledge Portal, The World Bank Group, 2022 |
|
Between 2015 and 2019, Omdurman gained 0.48 square kilometers of built-up area at the expense of bare or sparse vegetation typical to the climate of the region.
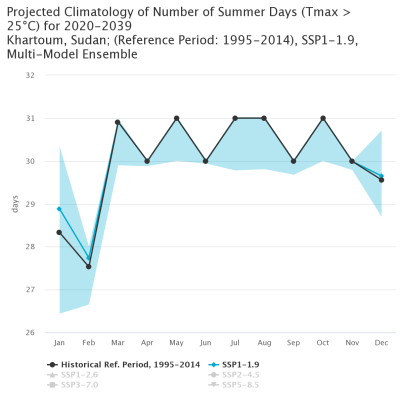
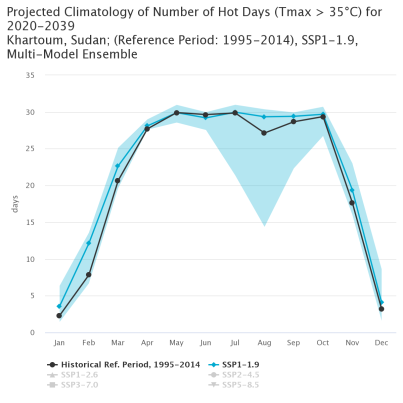
The Omdurman-Khartoum region has grown rapidly over the past three decades and is projected to see over 20 days per month of dangerous heat between April and October annually between 2020 and 2039. In addition to heat, increased flooding over the past decade has also created challenges for urban residents. [12] With this in mind, the city has a unique opportunity to use urban planning and expansion processes to mitigate both urban heat and flooding risks at the same time, leveraging its water resources for nature-based urban cooling.
São Paulo, Brazil
2015:20,883,000
2019:21,847,000
Present: 22,374,333
How to use the interactive map
|
|
|
Source: Climate Change Knowledge Portal, The World Bank Group, 2022 |
|
Between 2015 and 2019, São Paulo, Brazil increased its built-up area by 2.27 square kilometers and reduced its area of herbaceous vegetation by 1.1 square kilometers and its area of open forest by 1.03 square kilometers. The city also saw small reductions in its areas of cultivated and managed vegetation, bare or sparse vegetation, herbaceous wetland and closed forest.
In São Paulo, rapid urbanization is increasing the number of people living in informal settlements known as favelas. These are typically constructed to a low standard, often by residents themselves, and are often located on wasteland, marshy land, or in flood-prone areas.
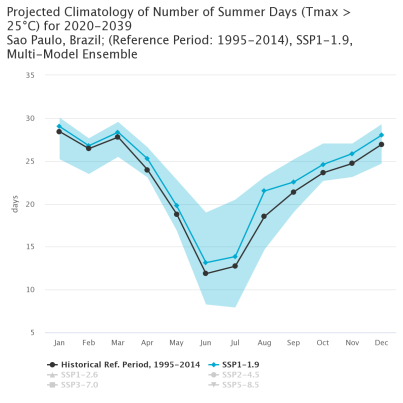
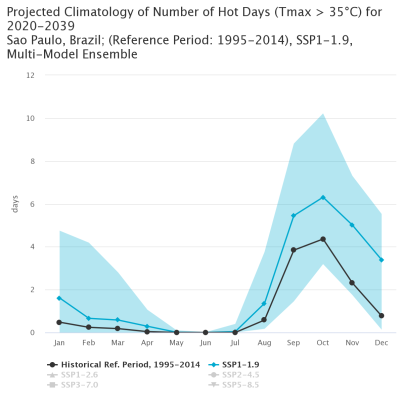
The city experiences sustained temperatures above 25°C in the summer months and is also projected to see four days per month of dangerous heat between September and November every year, exposing these residents to significant risks from lack of access to cooling. Targeted efforts to mitigate these risks include land-use planning changes that prioritize green spaces near favelas, and heat-action planning that provides them with public cooling centres on days when temperatures exceed 35°C.
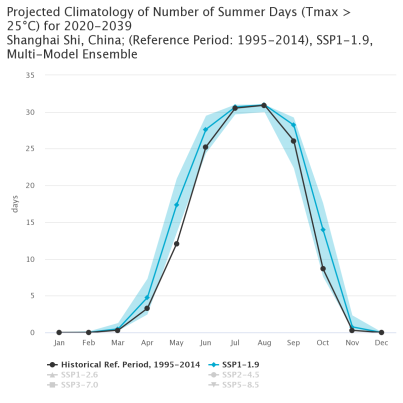
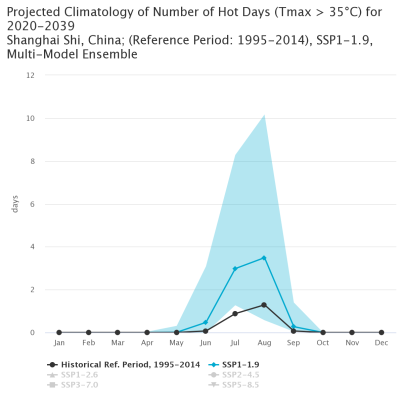
Shanghai, China
2015: 23,482,000
2019: 26,317,000
Present: 28,309,043
How to use the interactive map
|
|
|
Source: Climate Change Knowledge Portal, The World Bank Group, 2022 |
|
Between 2015 and 2019, Shanghai increased its built-up area by 8.96 square kilometers with a decrease of 0.78 square kilometers of shrubs, 1.32 square kilometers of herbaceous vegetation, 3.48 square kilometers of cultivated and managed vegetation, 0.16 square kilometers of herbaceous wetland, 0.16 square kilometers of open forest with evergreen broad leaf, and 3.38 square kilometers of open forest.
Shanghai has observed the highest increase in its built-up area among the major cities in the Critical 9 countries. The increase contributes to increased demand for air-conditioning and refrigeration systems, highlighting the need for energy-efficient and climate-friendly technologies. Demand can be expected to be particularly high in July and August, where temperatures are projected to exceed 35°C for three days each month.
For its most vulnerable residents, green spaces, passive cooling, and more vegetation can provide relief while reducing the UHIE and minimizing the energy necessary for cooling needs.
Notes and references
[1] Global Land Cover, Copernicus. Land Cover Viewer (vito.be)
[2] Buchhorn, M. ; Lesiv, M. ; Tsendbazar, N. - E. ; Herold, M. ; Bertels, L. ; Smets, B. Copernicus Global Land Cover Layers — Collection 2. Remote Sensing 2020, 12, Volume 108, 1044. DOI 10.3390/rs12061044
[3] Q-GIS software was used, which is a free and open-source cross-platform GIS software application that supports viewing, editing, and analysis of geospatial data. Discover QGIS
[4] RStudio is an Integrated Development Environment (IDE) for R, a programming language for statistical computing and graphics. About RStudio - RStudio
[5] The U.N. Climate report’s five futures – decoded. Explainer: The U.N. climate report's five futures - decoded | Reuters
[6] Climate Change Knowledge Portal (CCKP). About us | Climate Change Knowledge Portal (worldbank.org)
[7] Ürge-Vorsatz, D., Petrichenko, K., Antal, M., Staniec, M., Labelle, M., Ozden, E., Labzina, E. Best-Practice Policies for Low Energy and Carbon Buildings. A Scenario Analysis. Research report prepared by the Center for Climate Change and Sustainable Policy (3CSEP) for the Global Buildings Performance Network. May 2012.
[8] Rural population – Mozambique, The World Bank, 2022. Link.
[9] Mozambique Receives $100 Million for its Maputo Urban Transformation Project, The World Bank, 2020. Link.
[10] Urbanization in contrasting cities, BBC, 2022. Link.
[11] The Hindu, 18 March 2022, Link.
[12] Andrea Zerboni et. al (2021) The Khartoum-Omdurman conurbation: a growing megacity at the confluence of the Blue and White Nile Rivers, Journal of Maps, 17:4, 227-240, DOI: 10.1080/17445647.2020.1758810


