
Chilling Prospects Data Story: Heat Vulnerability Assessments in Low-Income Countries and Cities: Challenges and Opportunities
From national risk to local action
Extreme heat is now the deadliest climate hazard worldwide, causing an estimated 546,000 deaths annually (Lancet, 2025). Its impacts are felt acutely in low-income countries and cities, where exposure to extreme heat is high and the capacity to adapt remains limited. In 2025, Chilling Prospects estimated that nearly 700 million urban poor across the 77 countries assessed are at high risk due to a lack of access to cooling.
As urbanization accelerates, more than half of the world’s population now lives in cities and temperatures continue to rise. Decision-makers urgently need tools that can identify, at a granular level, which populations are most susceptible to heat-related harm and least able to cope and therefore how limited resources can be deployed effectively. Localized heat vulnerability assessments are a critical part of this response, helping to reveal spatial inequalities, prioritize interventions and guide both emergency action and longer-term planning.
Developing a heat vulnerability index
Heat vulnerability is typically understood as a function of three dimensions: exposure, sensitivity and adaptive capacity [1]. Developing a robust picture of these dimensions requires granular data on local climate conditions, housing quality, population health and socio-demographics, the extent of urban greenery and access to public services.
While there is no standardized methodology for heat vulnerability assessments, most involve developing a heat vulnerability index by selecting datasets for each dimension; aligning them to a common spatial unit; normalizing data onto a comparable scale; applying indicator weights; and combining them into a composite score that can be visualized across neighbourhoods or administrative boundaries.
Typically, the purpose of heat vulnerability assessments (e.g., anticipating future risk or revealing spatial inequality) and the local context (climate, demographics, governance) differ widely, and therefore a one-size-fits-all approach can be challenging to generate consistency. Instead, assessments should be approached pragmatically and with a focus on actionability.
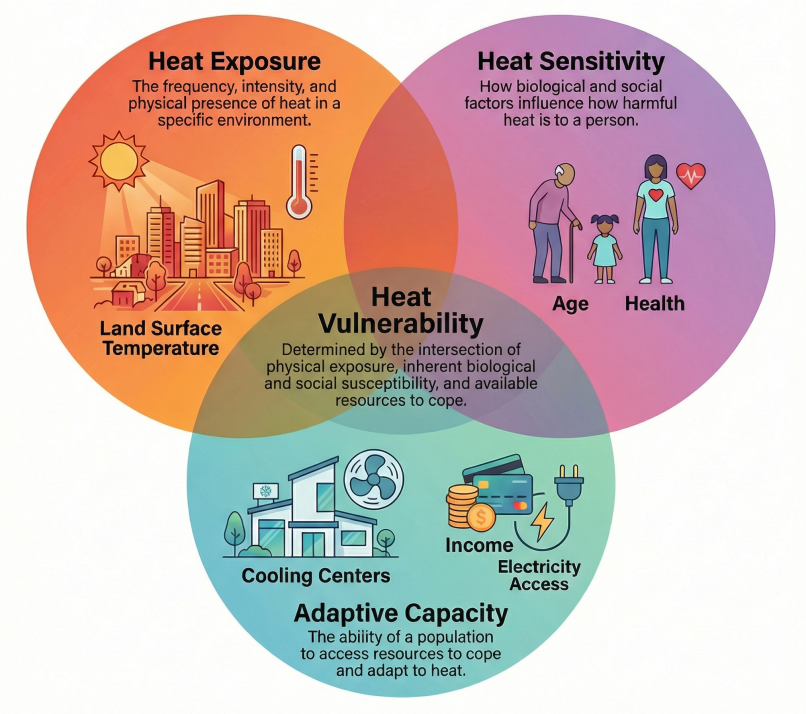
Figure 1. Understanding Heat Vulnerability (with example variables that can differ between studies),
Applications and validation of heat vulnerability indices
Applications of heat vulnerability indices are spreading globally. The Philadelphia Heat Vulnerability Index identifies neighbourhoods at greatest risk of heat-related illness and supports targeted outreach during heatwaves. In India, the Council on Energy, Environment and Water (CEEW) has developed district-level heat-risk mapping that informs disaster governance, early-warning systems and Heat Action Plans at scale. In the UK, Bristol’s local authority runs the Keep Bristol Cool mapping tool, which includes a heat vulnerability and outdoor exposure index at the neighbourhood level.
Validation of heat vulnerability indices remains limited, largely due to data constraints. However, where assessments have been tested against observed health outcomes, they generally show correlations with heat-related illness and mortality. When applied effectively, assessments can support public health protection, improve economic productivity and reduce heat-related morbidity and mortality.
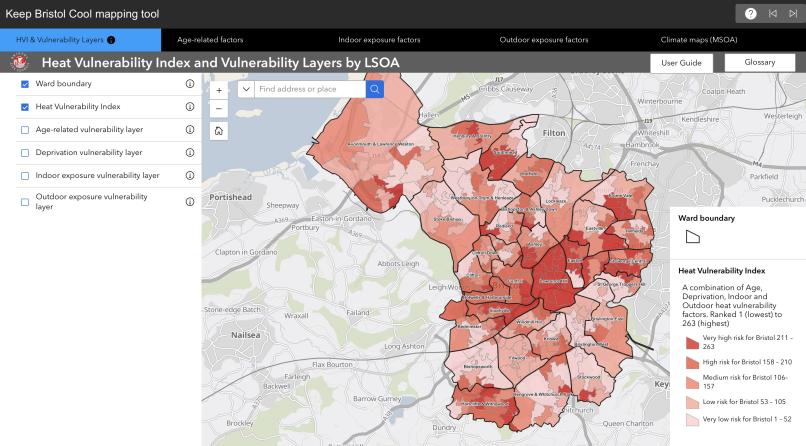
Figure 2: Snapshot of the Keep Bristol Cool mapping tool.
Key challenges in low-income contexts
There is a distinct lack of heat vulnerability assessments in low-income countries. Data gaps and institutional constraints, reflecting broader governance inequalities, are the most limiting factors in operationalising heat vulnerability assessments.
Fragmented and insufficient data systems make granular assessments particularly challenging. Systems to monitor and forecast heat events are severely lacking: Africa has only around 6% of the weather radar stations found across the US and Europe combined, despite having a similar population and far greater land area. While high-income countries maintain updated neighbourhood-level census and health datasets (e.g., London), many low-income countries lack recent censuses and robust civil registration systems. Nigeria's last official census was conducted in 2006 and the first and only census conducted in the Democratic Republic of the Congo is from 1984. Therefore, population characteristics often must be inferred from satellite data or small surveys.
Capacity constraints further limit uptake. Even where data exists, many local authorities lack the tools, staffing or training to analyse it, let alone the financial resources to take action to address heat risks. For instance, from SEforALL’s work with local governments, including the Kenyan Council of Governors, challenges commonly include limited internet connectivity, outdated hardware and software and limited awareness of the potential of Geographic Information Systems (GIS).
Opportunities and the way forward
A growing ecosystem of open-source datasets and tools can help bridge gaps. Land surface temperature from NASA EarthData and ESA’s Copernicus, population demographics from WorldPop and building and infrastructure data from OpenStreetMap, Google Open Buildings and Microsoft Global ML Building Footprints reduce barriers where local datasets are sparse. In many contexts, a simple, transparent heat vulnerability index built from a small number of strong indicators is more actionable than a complex model that cannot be easily updated. For example:
- A cool-roof programme could be informed by overlaying neighbourhood-level income status, residential building classifications and solar reflectance (as a proxy for roof albedo or material).
- A basic inventory of trees, parks, buildings and roads etc., can support local planning for shading, cooling and heat-resilient public spaces.
Despite information limitations, new targeted tools and platforms are also emerging. The World Resources Institute’s CityMetrics dashboard aggregates open data and geospatial indicators for more than 60 global cities. High-resolution urban climate models such as UrbClim or the open-source UMEP provide neighbourhood-scale heat projections all over the globe, while citizen science initiatives help validate model outputs and strengthen community engagement. Under UNEP’s Beat the Heat Implementation Drive, Ramboll has announced a digital tool enabling cities to model flooding and urban heat impacts and assess the benefits of proposed nature-based solutions.
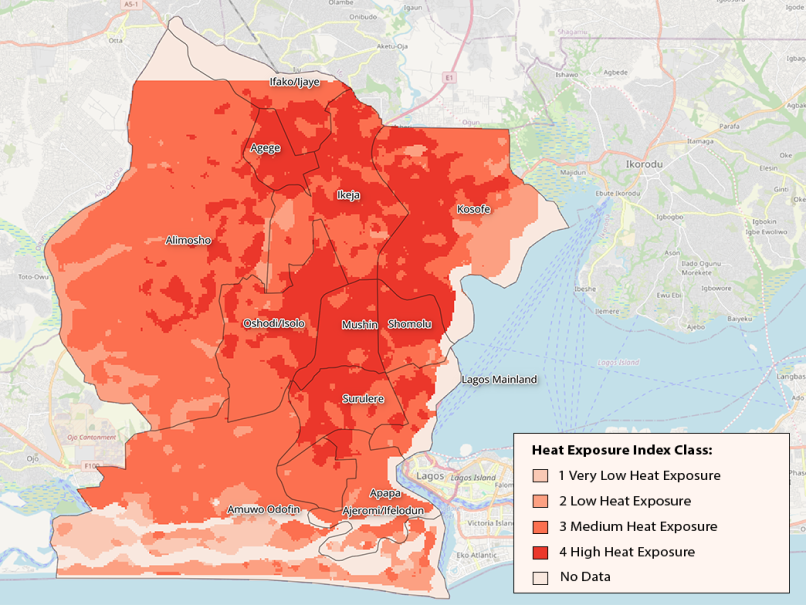
Figure 3: Preliminary Heat Exposure Index map for Lagos developed by SEforALL.
Cities are also finding innovative ways to generate missing data. Kampala, Uganda, for example, carried out a citywide tree audit as part of its 2016 Climate Change Action Strategy, mapping canopy cover and identifying neighbourhoods with severe deficits. This targeted, problem-driven data collection strengthened understanding of heat exposure and enabled the city to prioritise greening interventions despite limited resources.
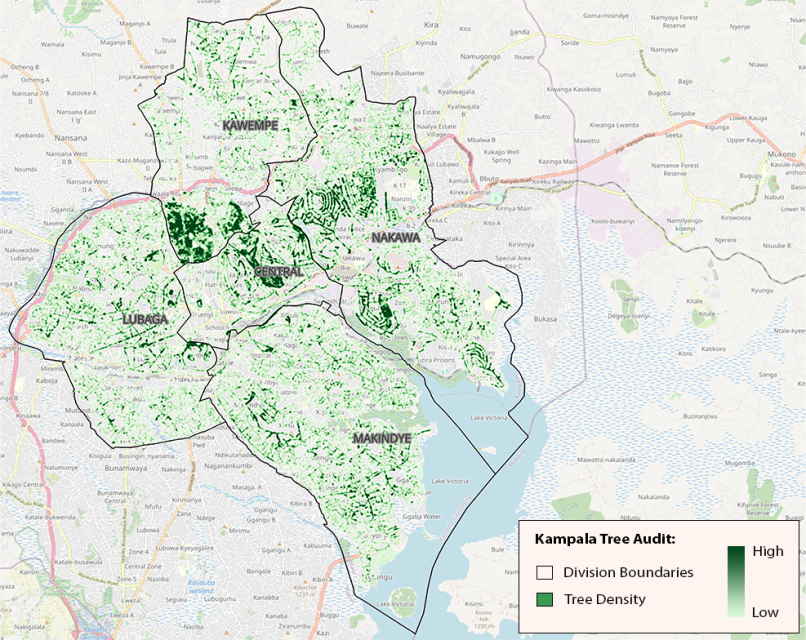
Figure 4: Kampala tree density map, based on the city’s tree audit.
Artificial intelligence (AI) presents opportunities to scale data modelling and extrapolation. SEforALL and IBM’s Open Building Insights (OBI) tool integrates open-source datasets with ML models to generate building-level information relevant to heat vulnerability assessments. This includes building type, structural characteristics (height, fabric density ratio), informal settlement classification and a number of parameters assessing exposure to heat stressors based on urban form, vegetation and proximity to critical infrastructure (e.g., medical support). The information can be useful when identifying heat-vulnerable neighbourhoods and quantifying potential measures needed.
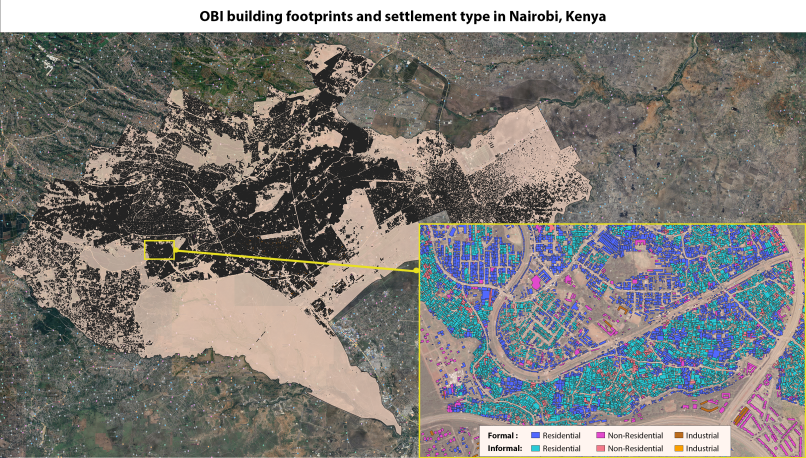
Figure 5: OBI building dataset for Nairobi, with an inset illustrating building classification and informal settlement type.
In the long term there needs to be investment in foundational systems: meteorological networks and early-warning systems, censuses and civil registration, health information systems and reliable datasets on buildings and infrastructure. Governments will often need to partner with academic institutions, international organizations, research entities and data providers to strengthen data collection, analysis and heat mapping in resource-constrained contexts.
Finally, there must be a concerted effort toward training and institutional capacity building so that geospatial heat assessments become embedded planning tools rather than donor-led or academically produced exercises. For instance, SEforALL has provided training and capacity building to support the Kenyan county governments prepare for extreme heat. Only with sustained local ownership can heat vulnerability assessments effectively support equitable, climate-resilient urban development.
[1] (Qian, Y., & Liu, T. (2025). Heat vulnerability assessment: A systematic review of critical metrics. Hygiene and Environmental Health Advances, 15, 100138. https://doi.org/10.1016/j.heha.2025.100138).


